To be able to adjust and create new energy policies the Flemish Energy and Climate Agency (VEKA) needs data to be able to make well informed decisions. To do this VEKA needs complete and high-quality data, this data mainly consist of data about green energy production and the energy performance of Flemish buildings. Apart from making policies VEKA also needs to report this data to its employees, other government organizations, the energy sector and the inhabitants of Flanders. The main goals of building a new data platform were:
VEKA quickly chose to set up their new data platform on the cloud. They made this decision because of the many advantages the platform brings, the main advantages are:
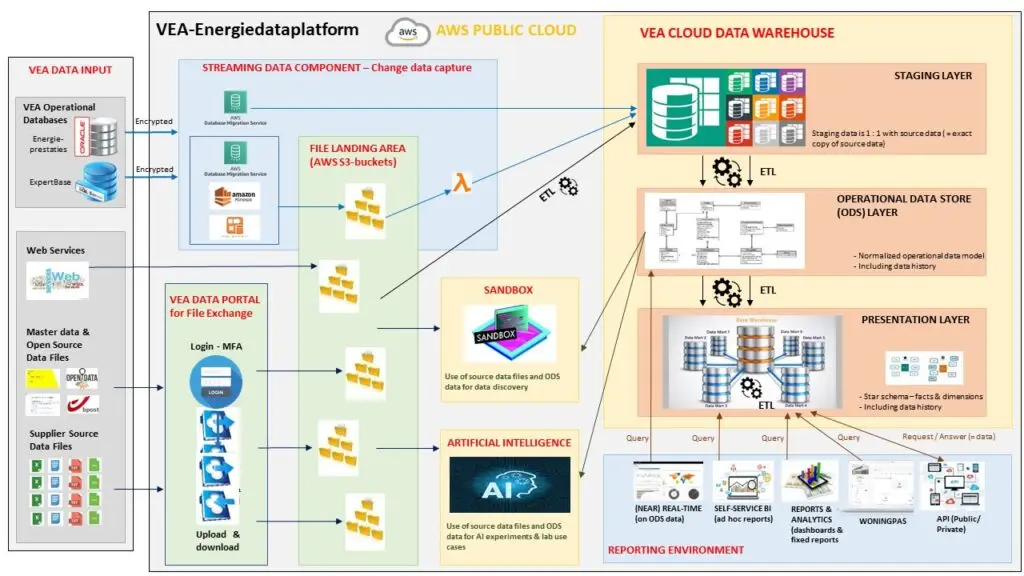
This is how VEKA’s new Data Warehouse as a Service (DWaaS) was born. All internal and external data gets loaded onto this platform, then users can log into the platform to access data and reports. In the next part of this article we will zoom in on the figure below.

Let’s start at the start, the data input. We have both internal and external data entering the DWaaS platform. This data is either uploaded regularly (every day, hour, week, month…) or gets uploaded in real-time. Files get uploaded through the data portal, this portal facilitates the exchange of files between VEKA and its suppliers. After getting uploaded the data will move on to the file landing area where an original copy is saved.
The incoming data gets processed as little as possible and gets saved in the first layer of the data warehouse (the staging layer). This way we can always access the original data. Now the first transformations will take place, we use ETL tools to do this. ETL stands for extract, transform and load. The data we need will be extracted from the source, then this data will be transformed to the right format. This way we can guarantee high quality data and uniformity throughout the data warehouse. Finally, the data is loaded into the second layer of the data warehouse (operational data store).
In the third layer of the data warehouse the data is transformed again to be able to use it in reports and visualizations. Reports are made automatically in Power BI every time new data gets uploaded. Users can now log into the platform to view the reports and data they have access to. They can filter this data to get the information that is relevant for them, someone working for the province of Antwerp can use a location filter to only get the data for this province.
In the middle of the figure there are two blocks we haven’t discussed yet. The first one is the sandbox; this is a space for employees to experiment with the data to gain new insights. The last block is the artificial intelligence space, VEKA experiments with different AI algorithms to try and gain more insight into their data. All these new insights can in turn be used to adapt and adjust policies.
VEKA’s main goal was to create a platform where all data is stored and processed in a uniform way. DWaaS is the perfect answer, the uniformity ensures everyone inside and outside VEKA sees the same data visualized in the same way which means there will only ever be one version of the truth.
Another hugely important goal was to be more efficient. A good example of how DWaaS achieves this by supporting VEKA’s staff when compiling the EPB-report that every new building in Flanders must obtain when applying for a building permit. This report used to be made by hand but now the tables and visuals will be generated automatically in Power BI. Staff will no longer waste time by imputing data, but they will be able to use this time to interpret this data.