Level up your business with Power BI
- Convenient dashboards
- Easy-to-share reports
- Fully automated reporting
- Real-time reporting
- One single version of the truth
As a Microsoft Gold Partner, we are constantly looking for the best solutions to support organizations during their digital transformation. Our team of BI cloud engineers and analysts strive to empower you to get the maximum out of your data. Want to know how Power BI can help your organization grow?

Why work with Power BI?
Inputting data
It doesn’t matter how your data is stored Power BI will have a way to access it. Power BI has a large collection of built-in connectors that can retrieve data from platforms like Google Analytics or Microsoft Azure.
Visualizing data
Design dashboards you won’t be able to live without. Power BI has many integrated visuals like line charts, bar charts or pie charts and more advanced ones like maps, tree maps and gauge charts. Do you want to visualize complex business processes? No problem, Power BI allows you to upload and use your own custom visuals.
Scalable insight
Power BI is easily scalable over small or large organizations. By assigning roles to the people in your organization, you can easily manage who can access and modify which report and what data.
Strategic and informed decisions
Power BI makes it easy to share data and reports, this way there will only ever be one version of the truth. Everyone in your organization will be able to make data-driven decisions.
Embedded BI
Embedded BI allows you to integrate your dashboards and reports into applications you currently use in your organization. This means that not everyone will have to learn to work with Power BI, some will just be able to view the reports inside other applications.
In need of accurate reporting?
Do you need a sales, marketing, HR or financial dashboard? Cloubis offers you a report structured following the DAR principle. During a few intense workshops we will collaborate with you to create a report you will want to use every day!
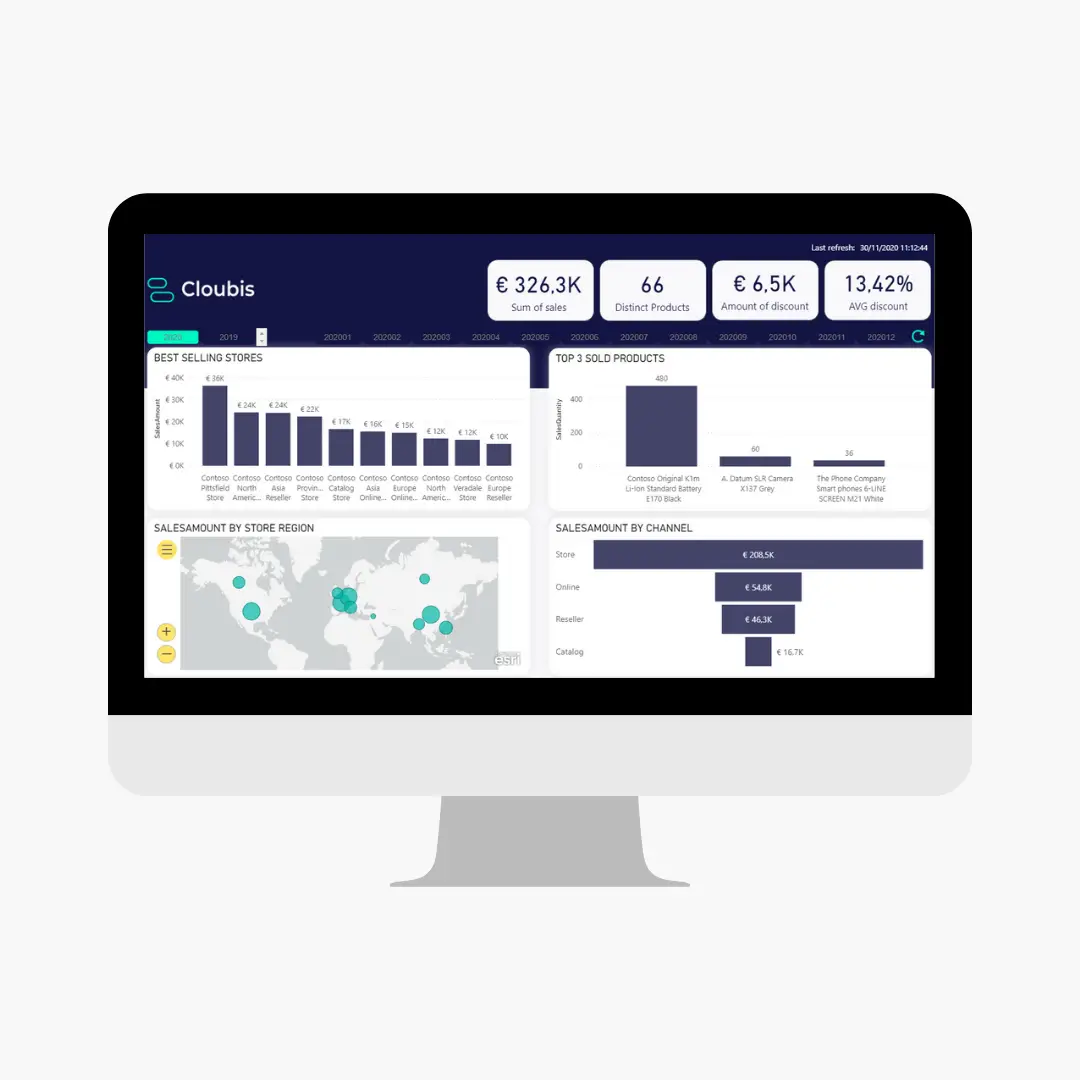
Dashboard
The dashboard page gives an overview of the most important information with less interactivity and functionality. It is mostly to help users scan for status updates.
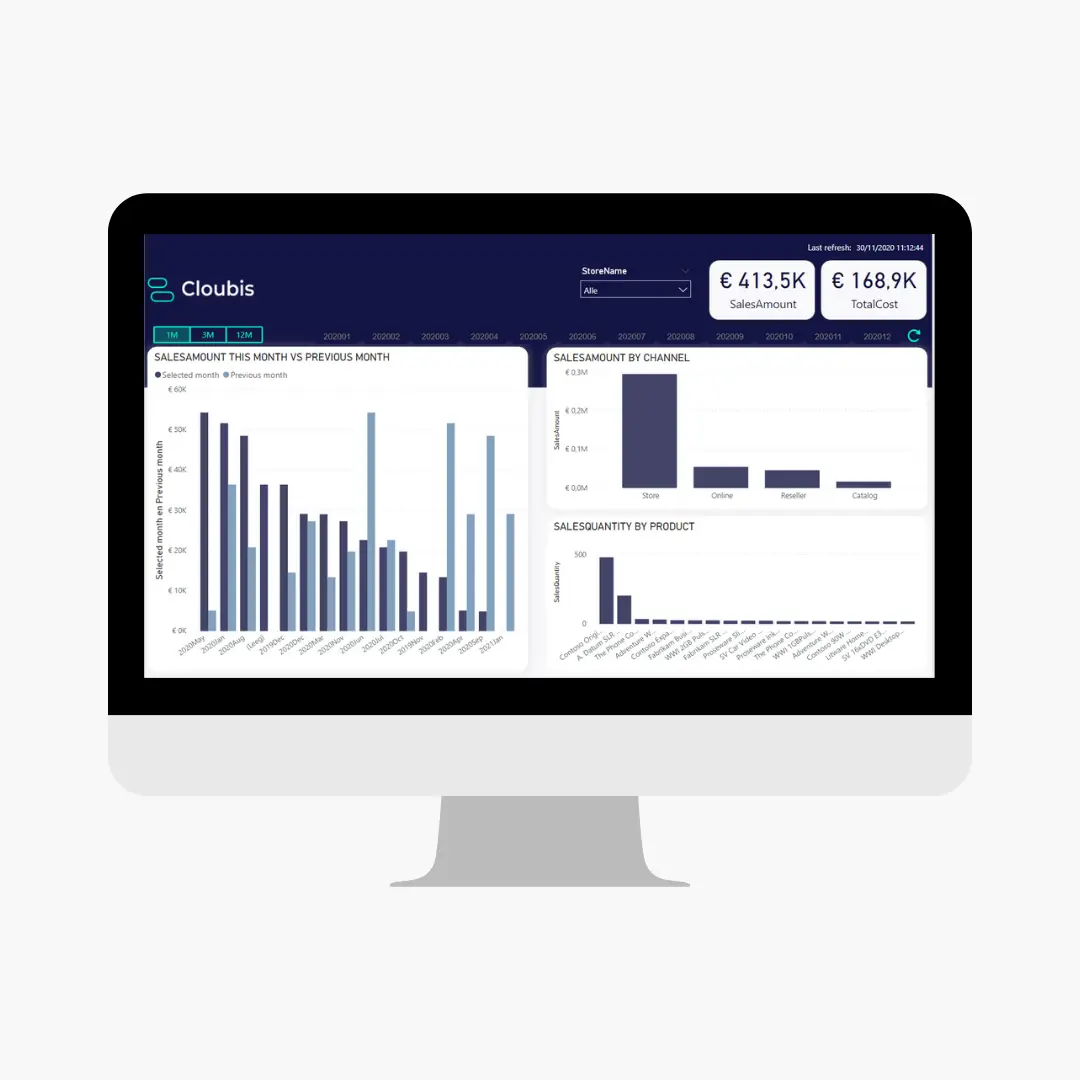
Analysis
Analysis pages are more interactive, they help users explore their data and look for answers to questions they may have formed on the dashboard page.
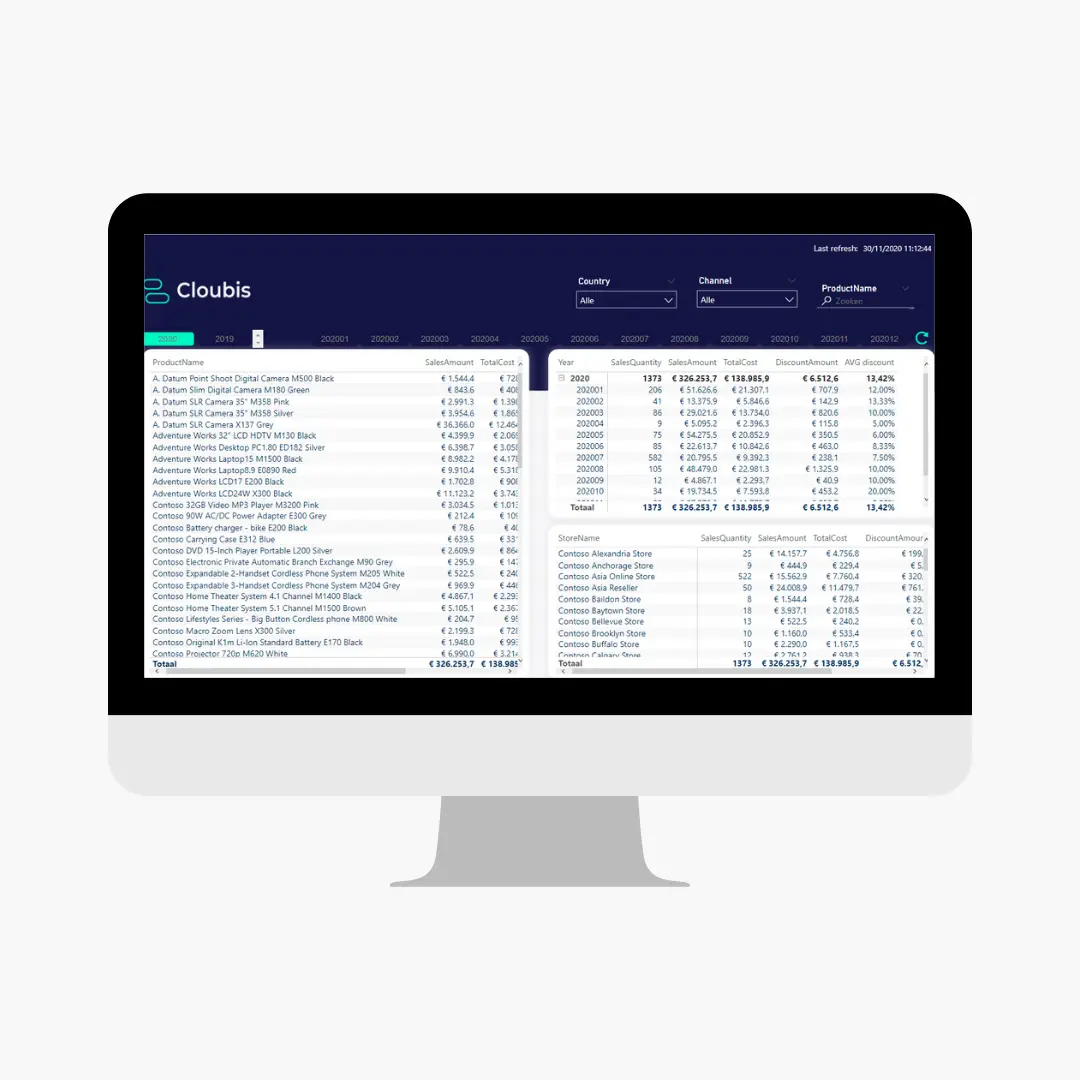
Report
Reporting pages give the most granular information with lots of tabular data and should ultimately lead to action.
Successful Cloubis collaborations
Curious about what Power BI can mean for you?
Do you need accurate reporting or do you want to integrate Power BI into your Business?
Do not hesitate to contact us, we will work out the best solution together.
Frequently Asked Questions
Still have questions about how Cloubis
can help your business with data?


