This blog is part 1 in our miniseries on real-time data analytics using Flanders’ traffic data. This miniseries was written in collaboration with Nick Van Hoof of TransIT.
Traditionally, batch-processing analytics was considered adequate as most BI users could meet their business goals by looking at weekly or monthly business numbers. Then why would you want or need real-time analytics? Because real-time analytics will allow you to be more reactive to what’s happening in and around your business at this very moment. Recently there has been a shift towards real-time analytics. Driving this shift are several factors such as increased access to data sources and improved computing power as a result of cloud computing.
Real-time data would allow you to make small changes here and there that in the long run will have a massive impact. A few examples are:
In this blog we will show you how to get this done using AWS Kinesis Data Analytics. It will author SQL code that will continuously read and process data in real time. When using this kind of data, we often speak of the hot path for the data. Hot because it’s still fresh out of the oven.
It is extremely important to think about your data access patterns upfront and to structure your data accordingly. This will ensure that the data that is available is compatible with the way you want to use it, allowing for (near) real-time interactions.
Data access pattern = the way you will interact with your data; which fields you will query on, what attributes you want to extract from nested data structures, …
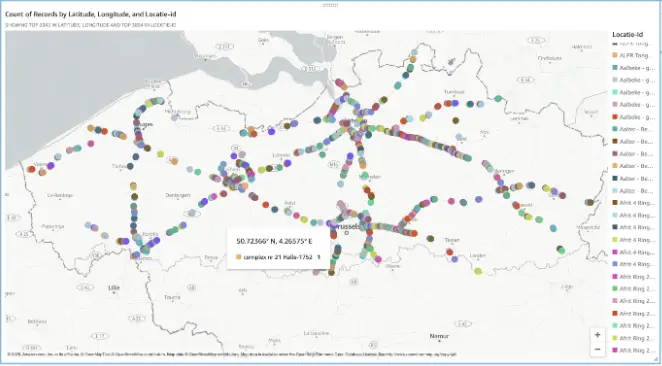
It’s always easier to learn when you have an example to learn from, that’s why in this blogpost we will be looking at data from the Flemish Traffic Institute. They are continuously monitoring traffic on Flanders’ highways. The image below shows all the locations where traffic is monitored.
This data is made available via an API where new data is added every minute. For a couple of critical locations we set up the following:
The government publishes the data every minute as a big blob of xml. It contains the information for all 4500 monitoring points. We immediately convert this file into a json file and divide the data into events per location. We do this processing by using AWS Lambda. As this is not the focus in this blog, we will not discuss this step in detail.
The per-location measurement events are then streamed over Firehose. This Firehose is used as an input for our Kinesis Data Analytics application, which will provide real-time insights. Next, the results of our real-time analytics with Kinesis Data Analytics are sent to a Kinesis Data Stream. This can then be used by a Lambda to, for example, generate traffic jam alerts or to save the results in a database.

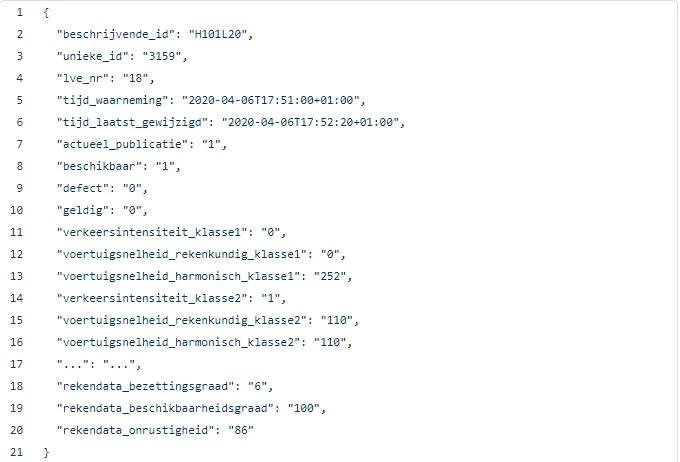
The format of the data arriving on Firehose is shown below. For the non-native Dutch readers, this data contains:
Let’s dig deeper into the architecture. We’ll start at the start, the Kinesis Firehose stream that is the source of our analytics. Firehose is described as follows:
Kinesis Firehose is a near real-time serverless service that can load data into your data lake or analytics tool and scales automatically.
Let’s dissect that definition:
It is important to note that there are two main options to stream your data, either Kinesis Firehose or Kinesis Data Stream. The first reason we decided to use Kinesis Firehose is that we did not want to handle sharding up or down ourselves. The second reason is that Firehose also allows 5000 writes per second while Data Streams will throttle you at 1000 writes per second (per shard). Finally, Firehose comes with the extra advantage that it can land your original data on S3 allowing you to build a data lake for batch processing later on. The flip side of the medal is that Firehose causes you to be near real-time instead of real-time, but this is a compromise we are willing to make.
The Kinesis Firehose/Data Stream that you choose as your input is your Streaming source. You point this streaming source to an in-application stream that is automatically created.
Let’s dive into the heart of our real-time analytics flow, namely Kinesis Data Analytics.
Kinesis Data Analytics allows you to analyze streaming data in real-time using SQL or integrated Java applications. In this case we chose to use SQL to write our real-time analytics. In our Analytics Application we’ll use the Firehose as the source.
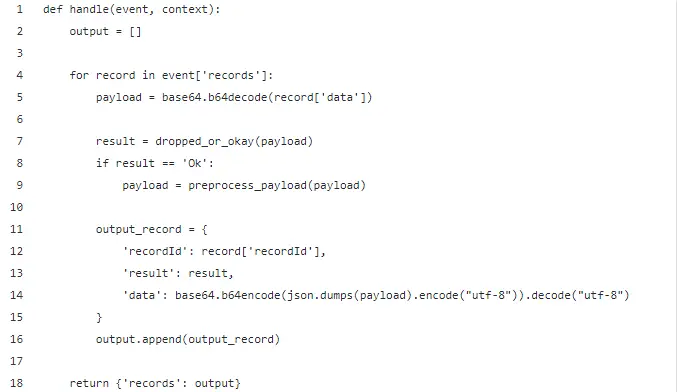
To preprocess all the records, we used a Lambda function that will sort through events. We are only interested in cars (class 2) so all other events will be dropped. The preprocess_payload method is used to modify the payload (method not shown here). I used this method to remove some unnecessary fields. The Lambda function below will receive batches of events and can transform, drop or pass these on one by one.
We see that the Lambda uses the dropped_or_okay() method to filter records. A record that will be dropped gets result Dropped, one that can pass gets result Ok.
The reason we are using Kinesis Data Analytics is that it allows you to perform real-time analytics while using SQL concepts.
Before diving into the queries there are two core concepts specific to Kinesis Data Applications to understand:
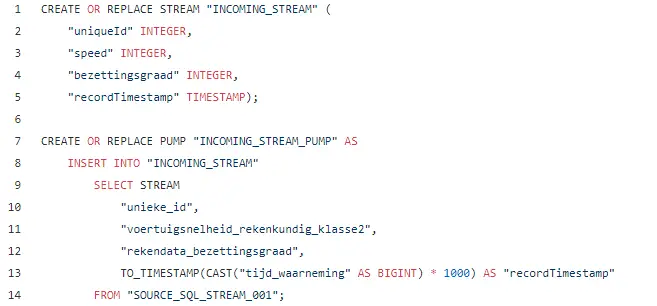
Let’s see a basic example of what that looks like. Remember the structure of the streamed events shown above.
Now we know about (intermediary) in-application streams and pumps. Let’s have a look at how we can make a window on our stream and aggregate results within that window. There are two kinds of windows: time-based vs row-based and 3 types: stagger, tumbling and sliding windows.
Concerning time- and row-based windows the names says it all. You either specify the window size in terms of time or number of rows.
Different types of windows:
A detailed explanation and example of these windows can be found in the AWS docs.
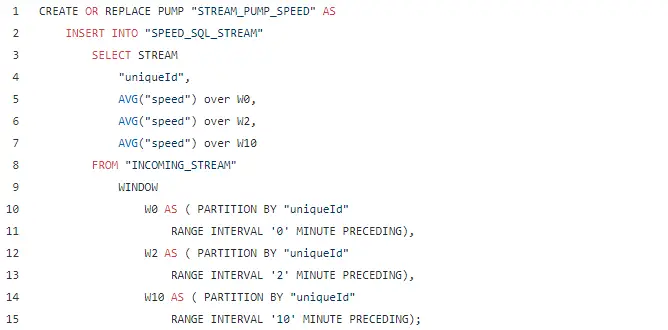
In our application we use the Sliding window to find out what the average speed over the last x minutes was. Below you can recognize three windows, indicating the last 10 minutes, 2 minutes and the current timestamp.
You cannot use a timestamp that originates from a field. This makes sense since you are working with real time data, which implicates the data should arrive in real time
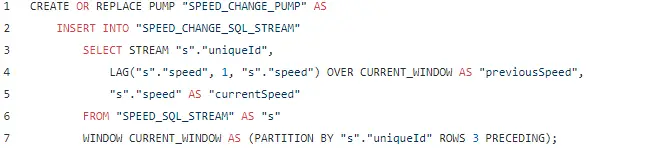
Using the LAG operator, we can look back in our window and access the data of the previous event(s).
In the following example, I am using LAG to look back in the current Sliding Window and extract the speed from the previous event. This allows me to output a new event with both the current speed and the previous speed.
You can add reference data to your stream to enrich the query results of your application. In our case the data already contains an ID, the place where the data was measured. The name of the places themselves are not included in the data. However, the ID of a place is linked to the name of that measurement location and can be found using reference data.
This reference data can be found in a csv file which in tab delimited. This file must be located on S3. When your application starts, it will read the file from S3 and make the data available as a table that you can use in your queries.
We saw that our intermediary results are always pumped towards an in-application stream. To get these results out of our application we have to connect the in-application stream towards an exterior data stream like a kinesis Firehose or a kinesis data stream.
Keep in mind that an in-application stream can only be connected to one exterior data stream. If you want to output the same result towards two different destinations, you’ll have to create another in-application stream which receives the same data.
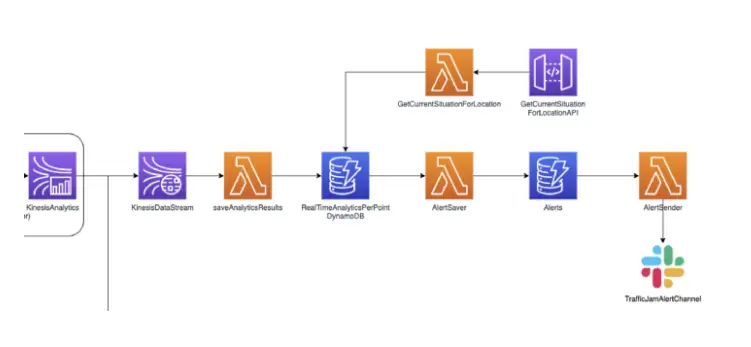
In the architecture diagram above you will notice that the kinesis data stream that receives the analytics results, is coupled to a Lambda Function. This means you could immediately send out alerts based on the data that the function receives from the stream. Or you can save the results in a real time data store which you can use to query for the current situation.
In this case I will choose the latter. I am storing the real time results in DynamoDB. This table holds the current situation for each of the different measuring points in Belgium. I then provide an API through which a client can view the current traffic situation in Belgium for a certain location.
Another Lambda Function is listening in on the change stream of this table. It’s monitoring whether a traffic jam is present or not. If the traffic jam flag switches between True and False we send out a slack message to notify that a traffic jam has appeared or has dissolved.
Great, we just learned how we can use Kinesis data analytics to get real time insights in our streamed data. In our case it gave us the possibility to get an on-demand view of the traffic jams in Belgium and send out alerts for emerging traffic jams. Below are the key takeaways from this article so you can go ahead and create your own real-time application!
This blog is part 1 in our miniseries on real-time data analytics using Flanders’ traffic data. This miniseries was written in collaboration with Nick Van Hoof of TransIT.